Landscape Processes
Processes occurring in the landscape can remove or reduce contaminant load.
There are several processes occurring in the landscape that can decrease the risk to water quality. To understand the role the landscape has in contaminant reduction, we need to explore the hydrological flow pathway that contaminants are transported by and the physical and chemical processes reducing contaminant concentrations and load to the receiving environment.
The landscape has the ability to reduce or remove contaminants through a number of natural processes that occur as water moves through the environment. The main processes that remove or reduce contaminant concentrations in the environment are:
- Dilution
- Resistance to physical disturbance and erosion
- Filtration and adsorption
- Attenuation by redox reactions
This section explores these process that reduce environmental risk in more detail. We recommend reading the Hydrology and Chemical Processes sections prior to this.
Why is the hydrology important for understanding contaminant risk?
Rainfall Volume and Seasonality
As water is the mechanism for transporting contaminants, the hydrology is critical for understanding contaminant loss. How much rainfall and when it is received varies significantly around New Zealand due to topographical and climatic differences varying the potential for contaminants to be transported. If conditions are dry, there is minimal contaminant loss. The most vulnerable time for loss is when conditions are very wet and water is discharged quickly to a waterbody.
In areas where it rains often, the period for accumulation of contaminants may be short resulting in a higher frequency of contaminant loss with a small contribution of contaminant each time. In contrast, areas with infrequent rainfall and sustained dry periods may have a long time before the soil is sufficiently saturated to mobilise contaminants. This gives the land time to accumulate contaminants, typically at the land surface. When a large weather event occurs or there is prolonged rainfall, a relatively larger amount of contaminant loss is likely to occur over this relatively short time.
The table below shows how the risk of overland flow occurring varies for regions around New Zealand (from McDowell et al, 2005). It is these wetter periods when saturation excess overland flow is most likely to occur. Saturation excess overland flow occurs when the soils are saturated and are not able to infiltrate water which results in runoff in sloping areas and ponding in flat areas. The regions that have the lowest risk are those that have the lowest annual rainfall. The table does not show the risk of infiltration excess overland flow occurring which can happen at any time of the year when rainfall intensity is higher than the infiltration rate of the soil. Soils affected by pugging and compaction are most vulnerable to runoff occurring.
| Location | Meteorological Station | Jan | Feb | Mar | Apr | May | Jun | Jul | Aug | Sep | Oct | Nov | Dec |
|---|---|---|---|---|---|---|---|---|---|---|---|---|---|
| Northland | Kaikohe | ||||||||||||
| Auckland | Auckland Airport | ||||||||||||
| Waikato/Coromandel | Ruakura | ||||||||||||
| Bay of Plenty | Whakarewarewa | ||||||||||||
| Central Plateau | Taupo | ||||||||||||
| King Country | Rukuhia | ||||||||||||
| Taranaki | Stratford | ||||||||||||
| East Coast1 | Gisborne Airport | ||||||||||||
| Manawatu/Whanganui | Grasslands | ||||||||||||
| Wellington | Kelburn | ||||||||||||
| Nelson | Nelson Airport | ||||||||||||
| West Coast | Hokitika Airport | ||||||||||||
| Marlborough | Lake Grassmere | ||||||||||||
| Canterbury | Lincoln | ||||||||||||
| Otago | Dunedin Airport | ||||||||||||
| Southland | Gore | ||||||||||||
| High Country2 | Hermitage Mt Cook | ||||||||||||
| High Country3 | Omarama |
- 1 High risk is allocated to February and March in this region due to the presence of hydrophobic soils.
- 2 High Country (> 300 m), high rainfall (> 700 mm).
- 3 High Country (> 300 m), low rainfall (< 700 mm).
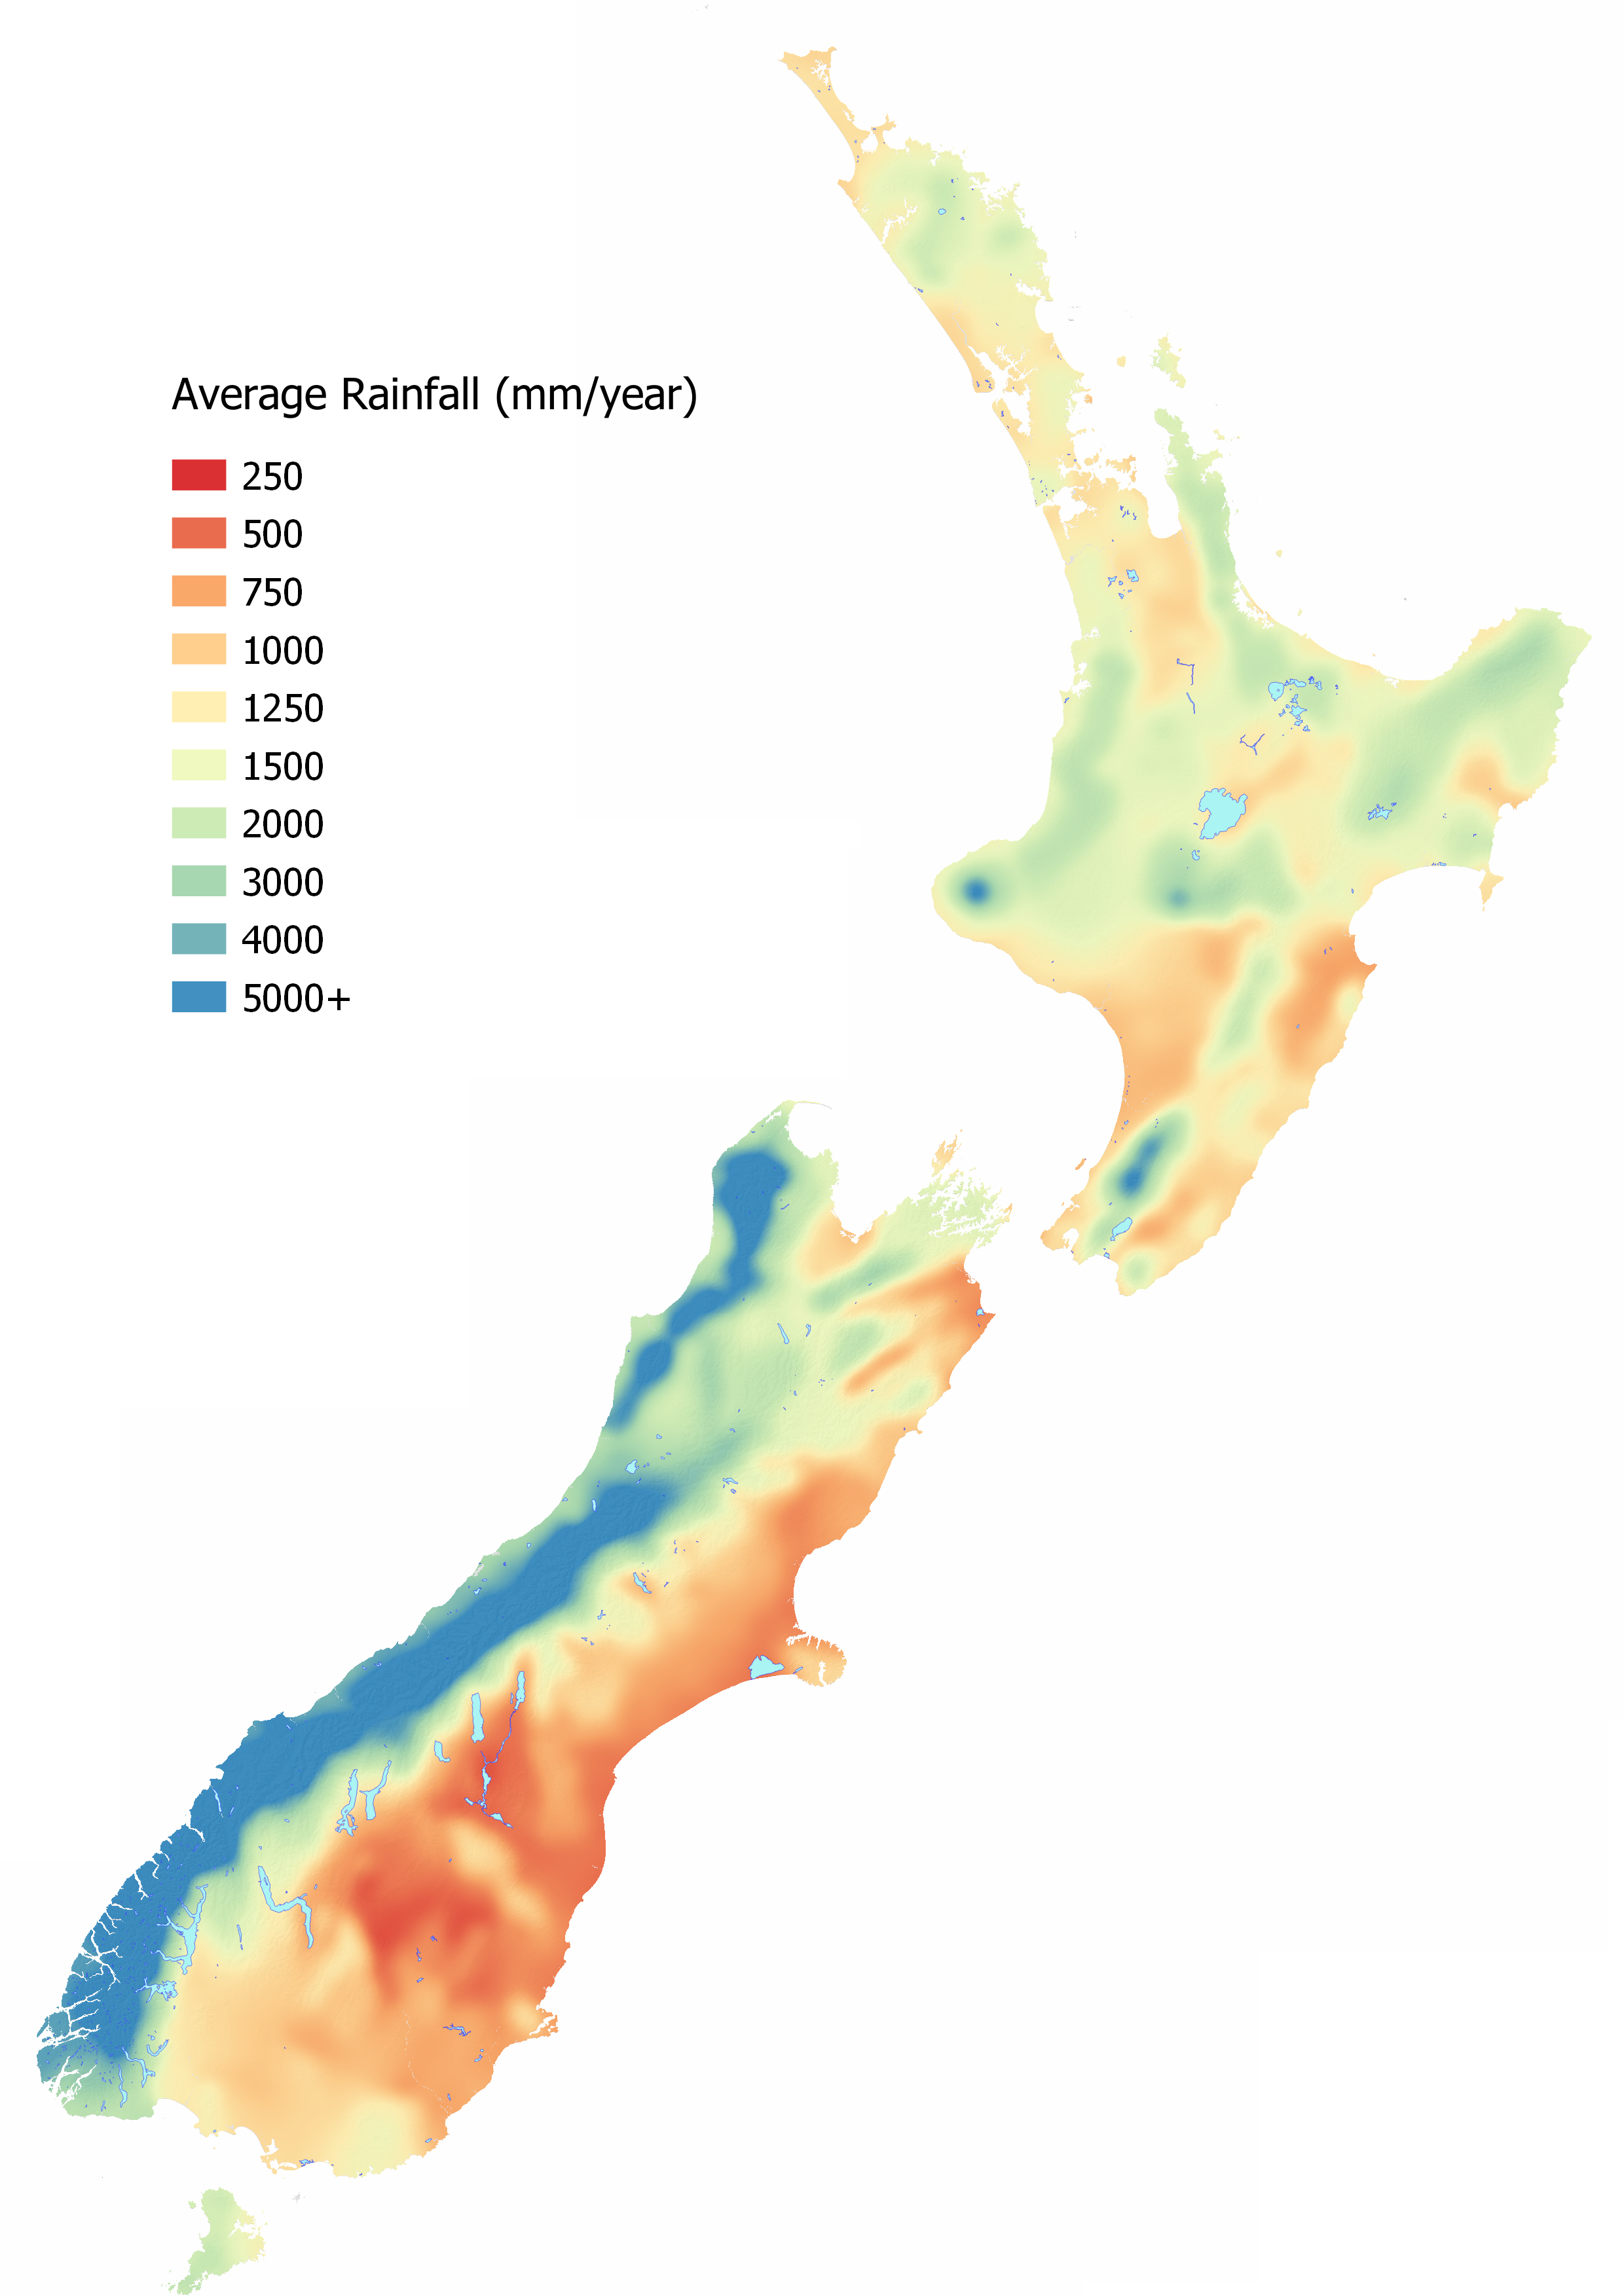
See MAPS – OTHER INFORMATION for an interactive map to identify the Average Annual Rainfall at your location.
Data source: NIWA.
Flow Pathway
Contaminants are transported either dissolved in the water or as particles entrained in the water. Therefore, the flow pathway that water takes after rainfall is critical to understanding what contaminants are likely to be lost. Dissolved contaminants, such as nutrients (nitrate nitrite nitrogen, ammoniacal nitrogen, dissolved reactive phosphorus) can be transported by all pathways, while particulate contaminants, such as sediment, sediment-bound nutrients, and microbes, are predominantly transported by overland flow and bypass pathways. Read more about hydrological flow pathways in SCIENCE – HYDROLOGY.
When water from two different sources mix, dilution can occur reducing the concentration of the contaminant in the waterway. Water sourced from higher up the catchment is the most dilute and increases in contaminant concentration occur down the catchment as water from various drains, streams, groundwater, and local rainfall mix. Water discharging to the receiving environment at the bottom of the catchment, represents a mix of all the upstream sources of water and the landscape process that occur within.
The most direct flow pathway for contaminants to reach a waterway is by overland flow (or runoff) over the land surface. As the soil and aquifer is bypassed by this process, nutrients are not able to be utilised or particulates entrained in the soil zone resulting in nutrients, sediment, and microbes being transported quickly and deposited into a waterway. How resistant the landscape is to physical disturbance and erosion is critical to sediment generation and loss.
When water can percolate through the soil to depth, the contaminants are reduced by the processes of filtration and adsorption and chemical redox reactions. The form of the nitrogen is dependent on the redox conditions of the soil and underlying aquifer. In oxidising environments, nitrate nitrogen is the form most mobile. In reducing environments, nitrate nitrogen is denitrified to nitrogen gas or to nitrous oxide (a harmful greenhouse gas). The more reducing an environment becomes, the more mobile phosphorus is, as the iron oxides and oxyhydroxides that phosphorus adsorbs to in the soil are mobilised. Denitrification however is more complete, reducing the likelihood of nitrous oxide being produced.
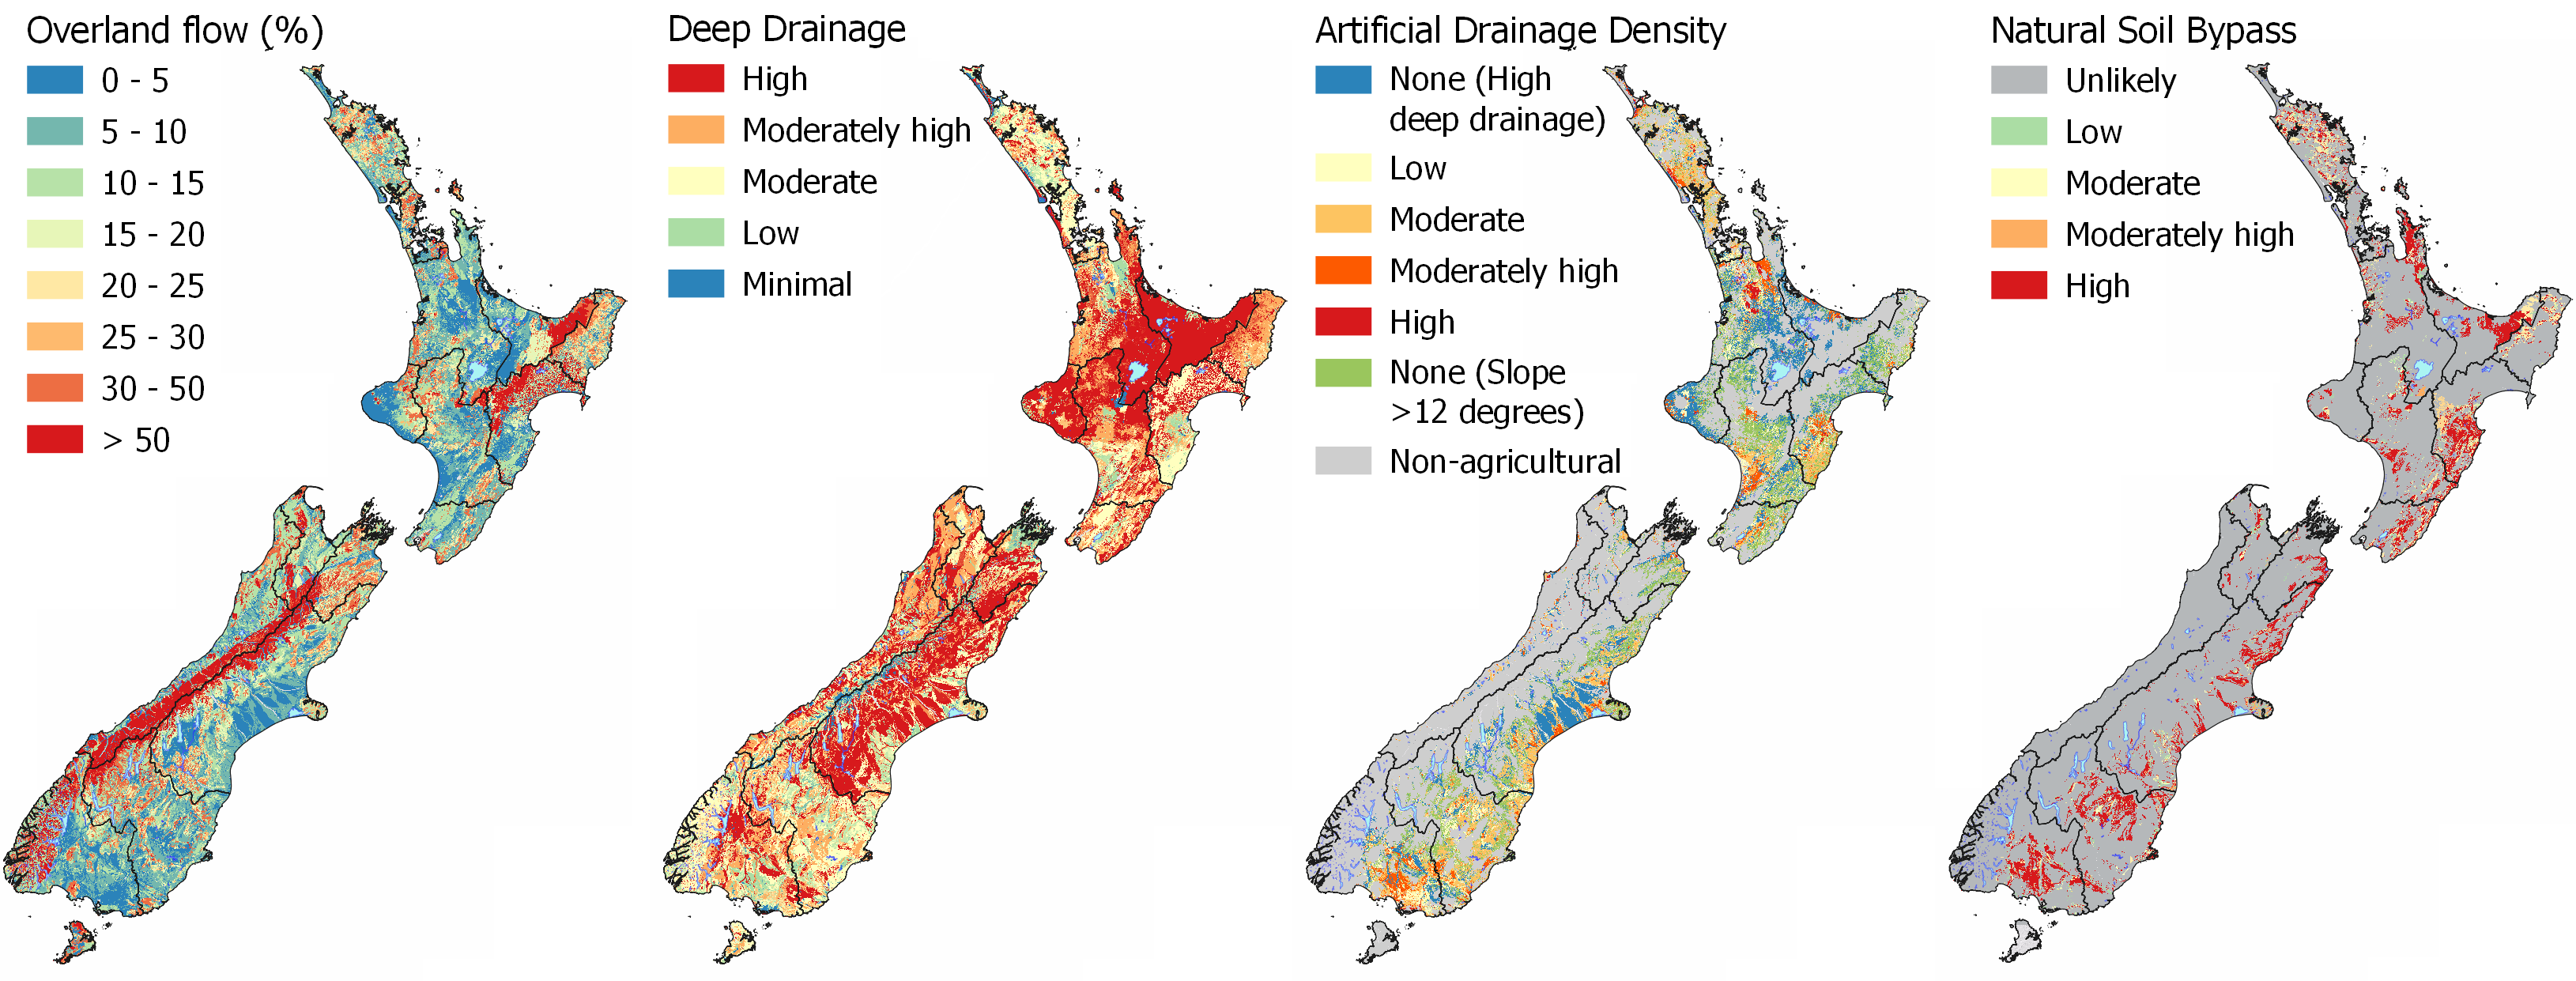
Explore the MAPS - HYDROLOGY for interactive maps to compare the flow pathways of Overland Flow, Deep Drainage, Lateral Drainage, Artificial Drainage, and Natural Soil Bypass at your location.
What is dilution?
Dilution is the process of decreasing the concentration of a contaminant and occurs when a higher volume of low concentration water mixes with a smaller volume of more concentrated water. For example, a large volume of rainfall or snowmelt from higher up in a catchment will dilute more concentrated flows that occur at lower elevation. The result is a net reduction in contaminant concentration from the mixing of the different sources of water, e.g., hill and lowland.
It is important to note that while dilution may alter the concentration of a contaminant in the stream, it is not a true reduction as it does not reduce the total load (amount) of that contaminant to the receiving environment.
Load is how much of a contaminant reaches the receiving environment over a period of time. If the receiving environment is under pressure from this contaminant, reductions in the contaminant load will be necessary to improve water quality.
Why is water source important? What is dilution potential?
Water source identifies where the water in the stream has come from and the potential to dilute contaminants.
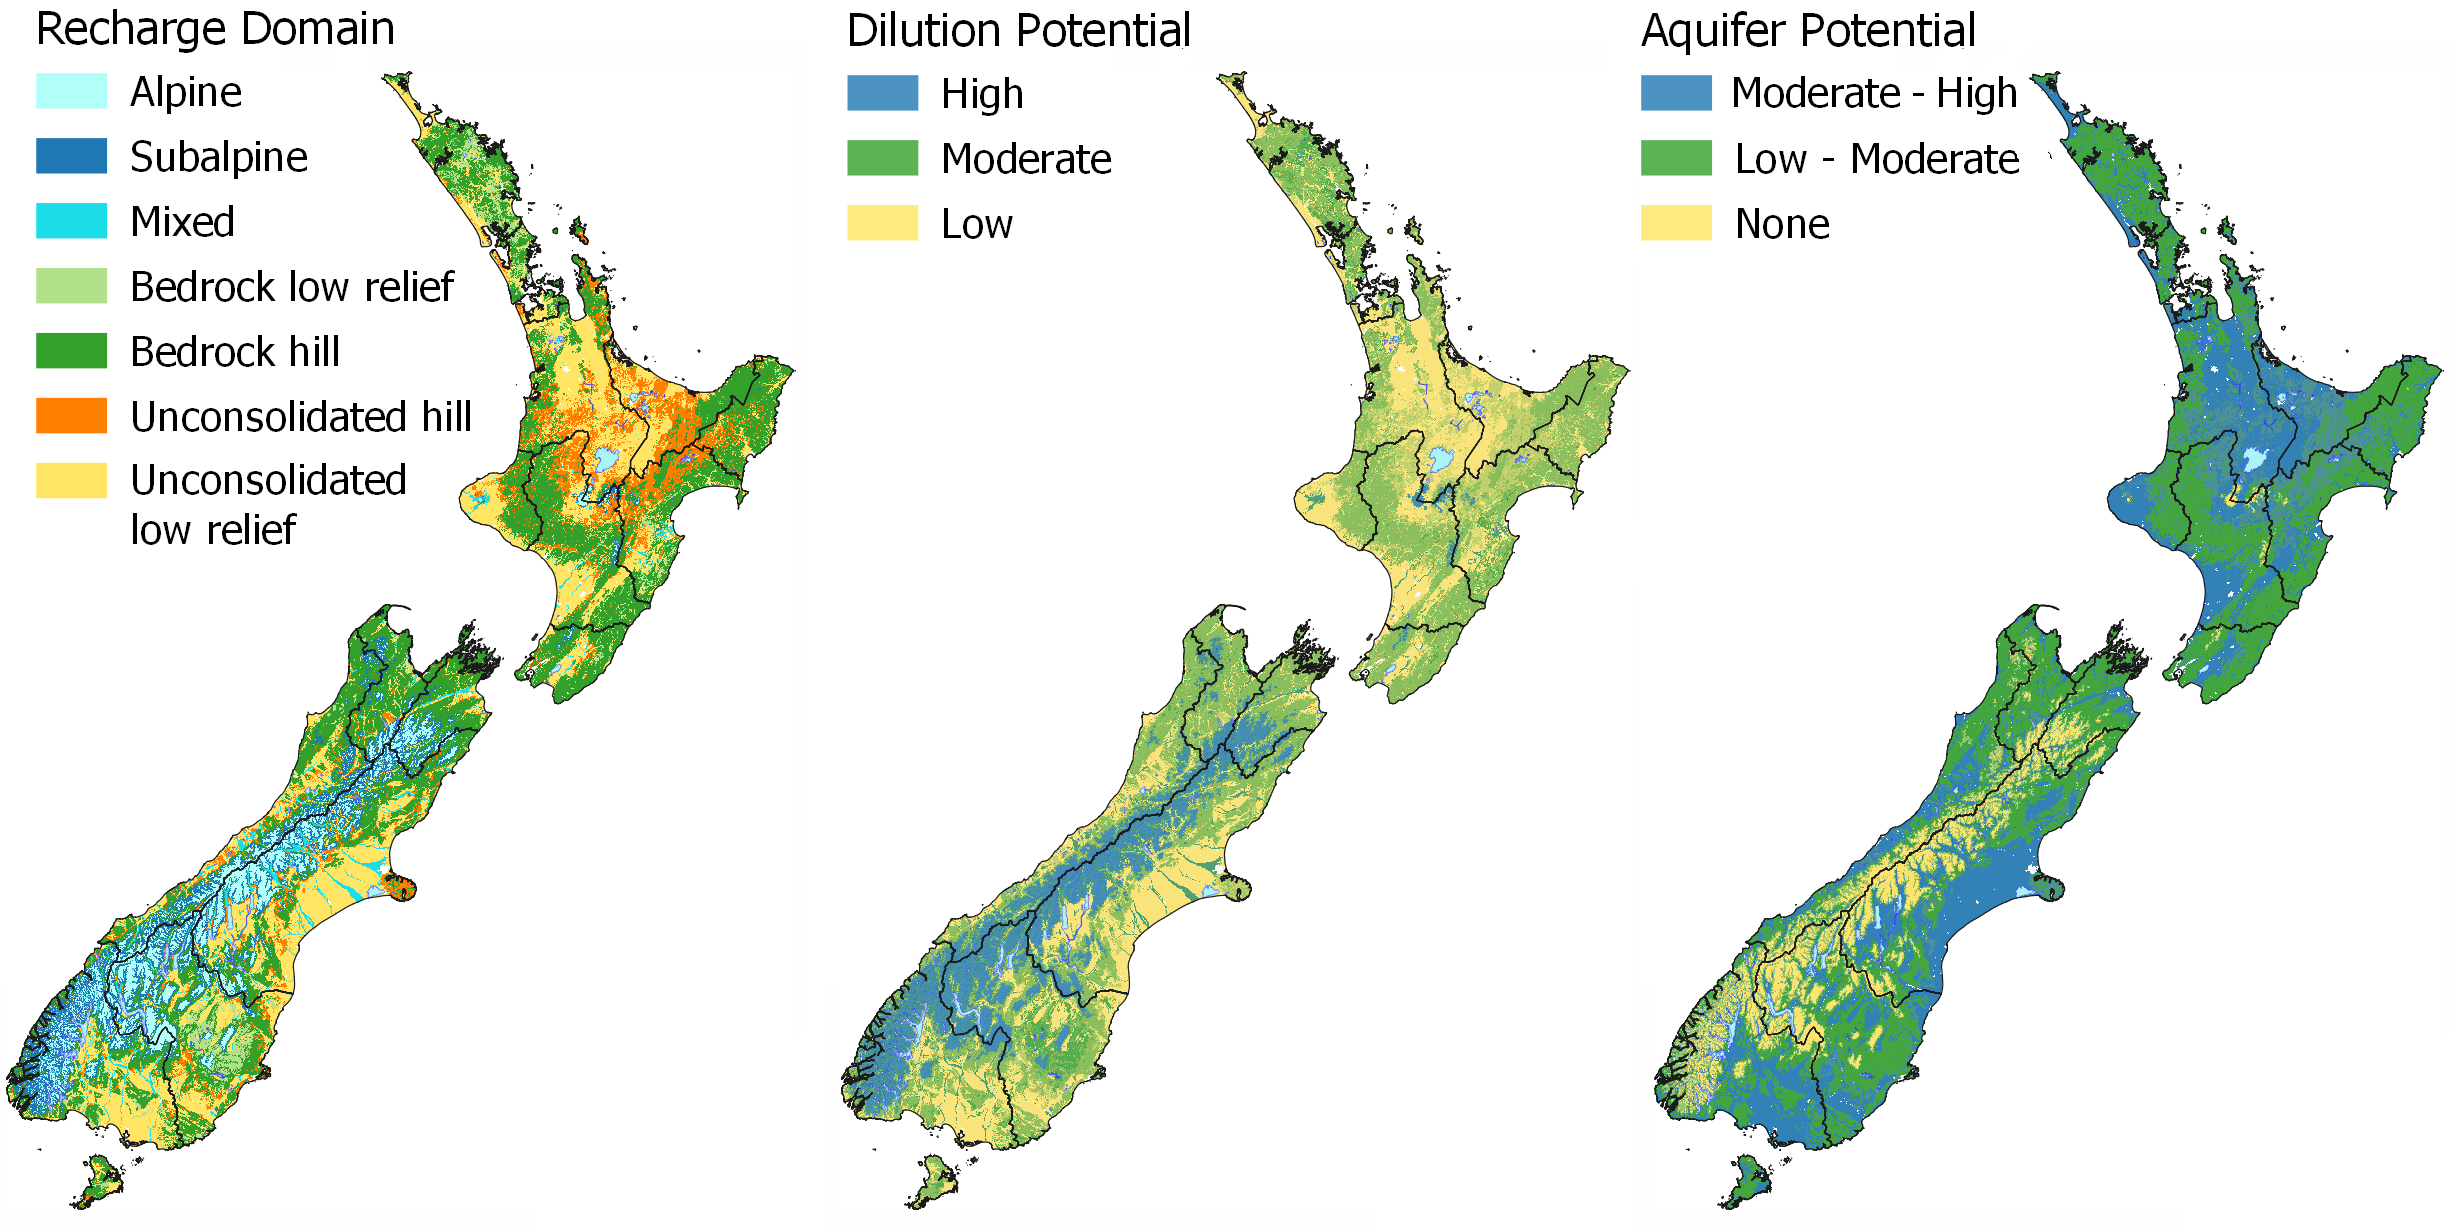
In MAPS – HYDROLOGY the Recharge Domain map can be used to inform the water source and dilution potential of a stream or aquifer. The Alpine Environment has a high dilution potential due to the large volume of pristine water that is discharged from the environment and low land use pressure. Bedrock Physiographic Environments have a moderate dilution potential due to typically higher rainfall and lower land use intensity, whereas lowland areas have a low dilution potential as water is sourced from local rainfall, with no mixing of water sources and are typically under higher land use pressures. In the Physiographic Environments, the high dilution potential and connectivity to alpine sourced water is used to classify the Riverine Environment. The Riverine Environment is the only lowland physiographic with a high dilution potential. This is because the source of the water is mixed with alpine, bedrock, and local lowland sources.
While dilution may influence the concentration of contaminants in a waterway, it does not alter the total contaminant load that is transported down the waterway. This means that the same amount of contaminant may end up in a lake or estuary from a larger volume of water. If the receiving environment is sensitive to that contaminant, it is likely to be an issue for water quality.
Where do the waterways on my property come from and go to?
In MAPS – HYDROLOGY the Recharge Domain map and the Riverlines Source (overlay) help to identify the source of water in your local stream or river. You can see which recharge domain a waterway originates in as the riverlines are coloured to match the source of the water. View your local area with the Catchment Boundary on to see the drainage area for your local river or stream. This will show you where water is coming from and going to on your property.
The catchments shown here are the sea draining catchments, so some areas will have very large catchment areas while others will be small. Catchments of lakes are not identified so in these locations you will have two receiving environments, the local lake (not identified) and the large catchment that discharges to the sea.
In some instances, you may find your property crosses a catchment boundary, be aware of the local authorities’ rules for their Freshwater Management Units as you may find there are different planning rules for each area. Find out more about what Freshwater Management Units are in SCIENCE – LEGISLATION.
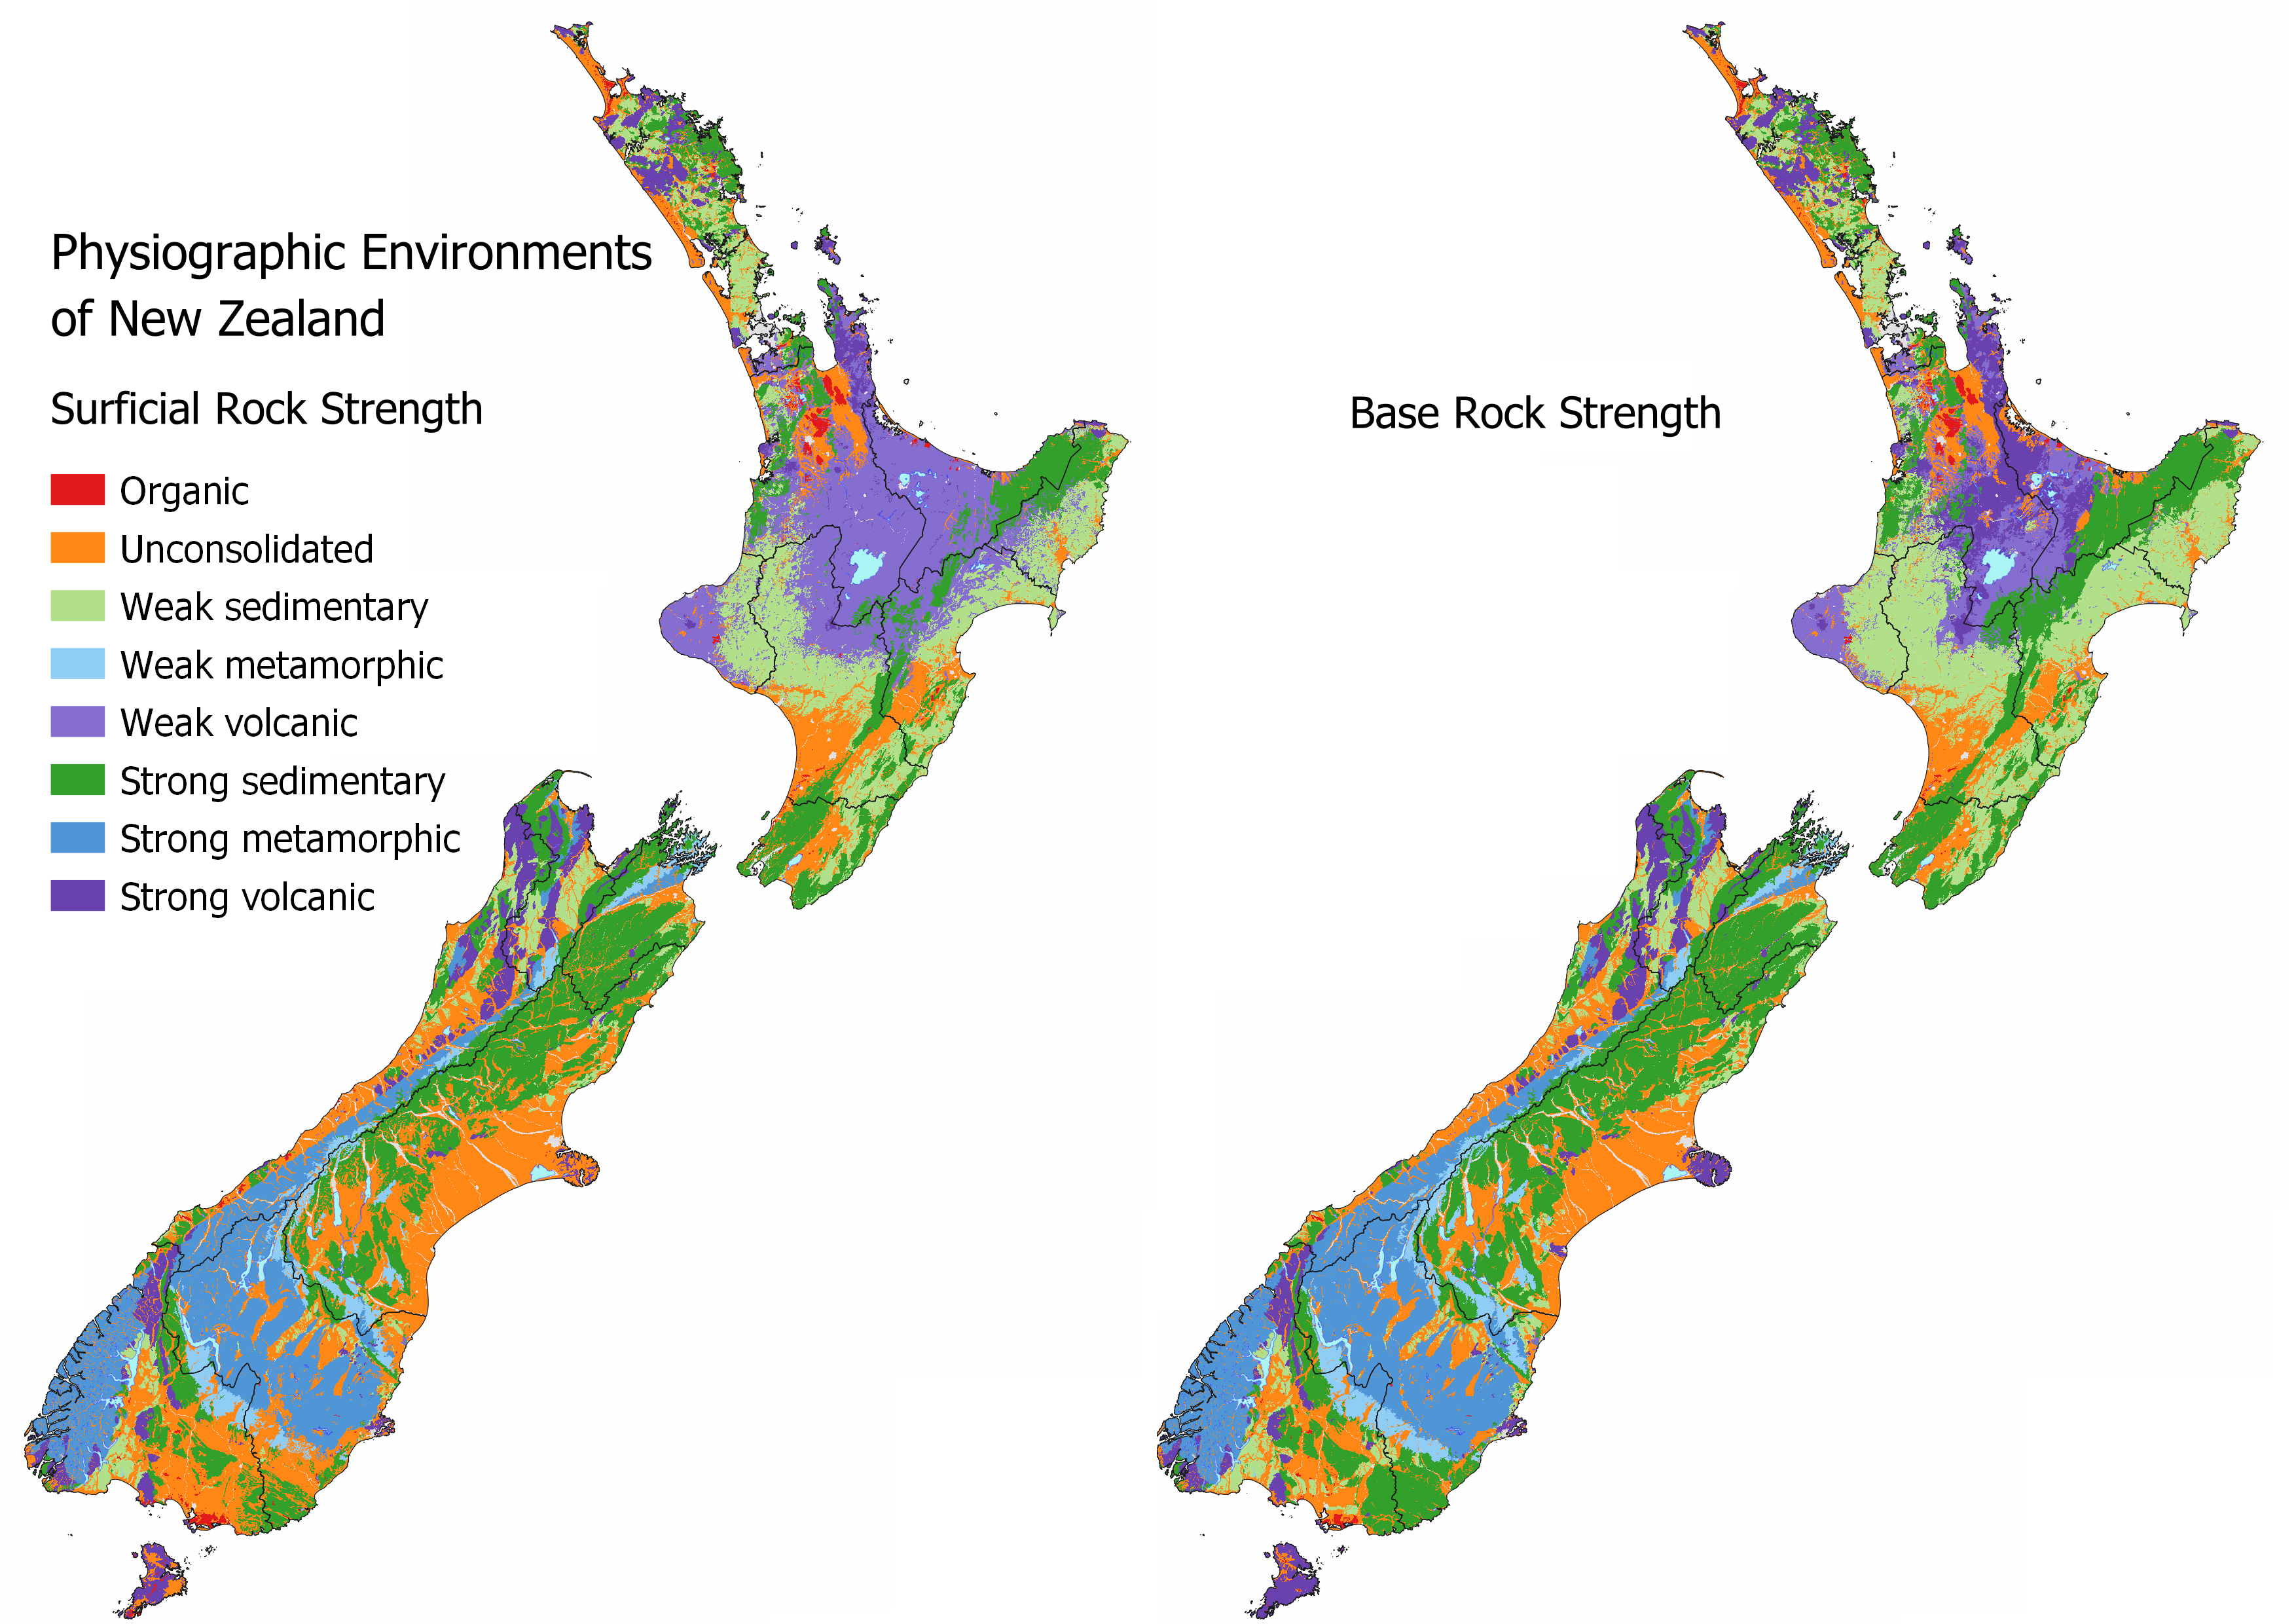
Why are some areas more resistant to erosion?
Resistance to physical disturbance represents the landscapes’ ability to resist weathering processes, such as erosion and mass wasting. Stronger more resistant rock types weather more slowly and are less likely to succumb to erosion. Traditionally there has been a focus on slope and vegetation cover as an assessment for the erodibility of the land surface. However, while this is generally correct, the underlying geology is likely the first controlling factor. This means areas with unconsolidated or weak geologies will never become as steep as areas with stronger geologies because they are continuously being eroded and should have a higher risk for sediment generation.
Land use is also critical to sediment risk. Sediments that have been enriched with nutrients, such as our agricultural land, are more likely to cause problems in the surface waterways, lakes, and estuaries. Sediment generated from natural state environments might make up a large volume but are typically less nutrient rich and are lower risk to the receiving environment and contribute the background load.
See MAPS – OTHER INFORMATION for as interactive map to identify the Surficial Rock Strength and Base Rock Strength at your location. Areas that have the largest issues with sediment and erosion coincide with weak sedimentary or unconsolidated geologies irrespective of land use. Intensive land uses over areas that are highly susceptible to erosion are likely to have the highest sediment loss.
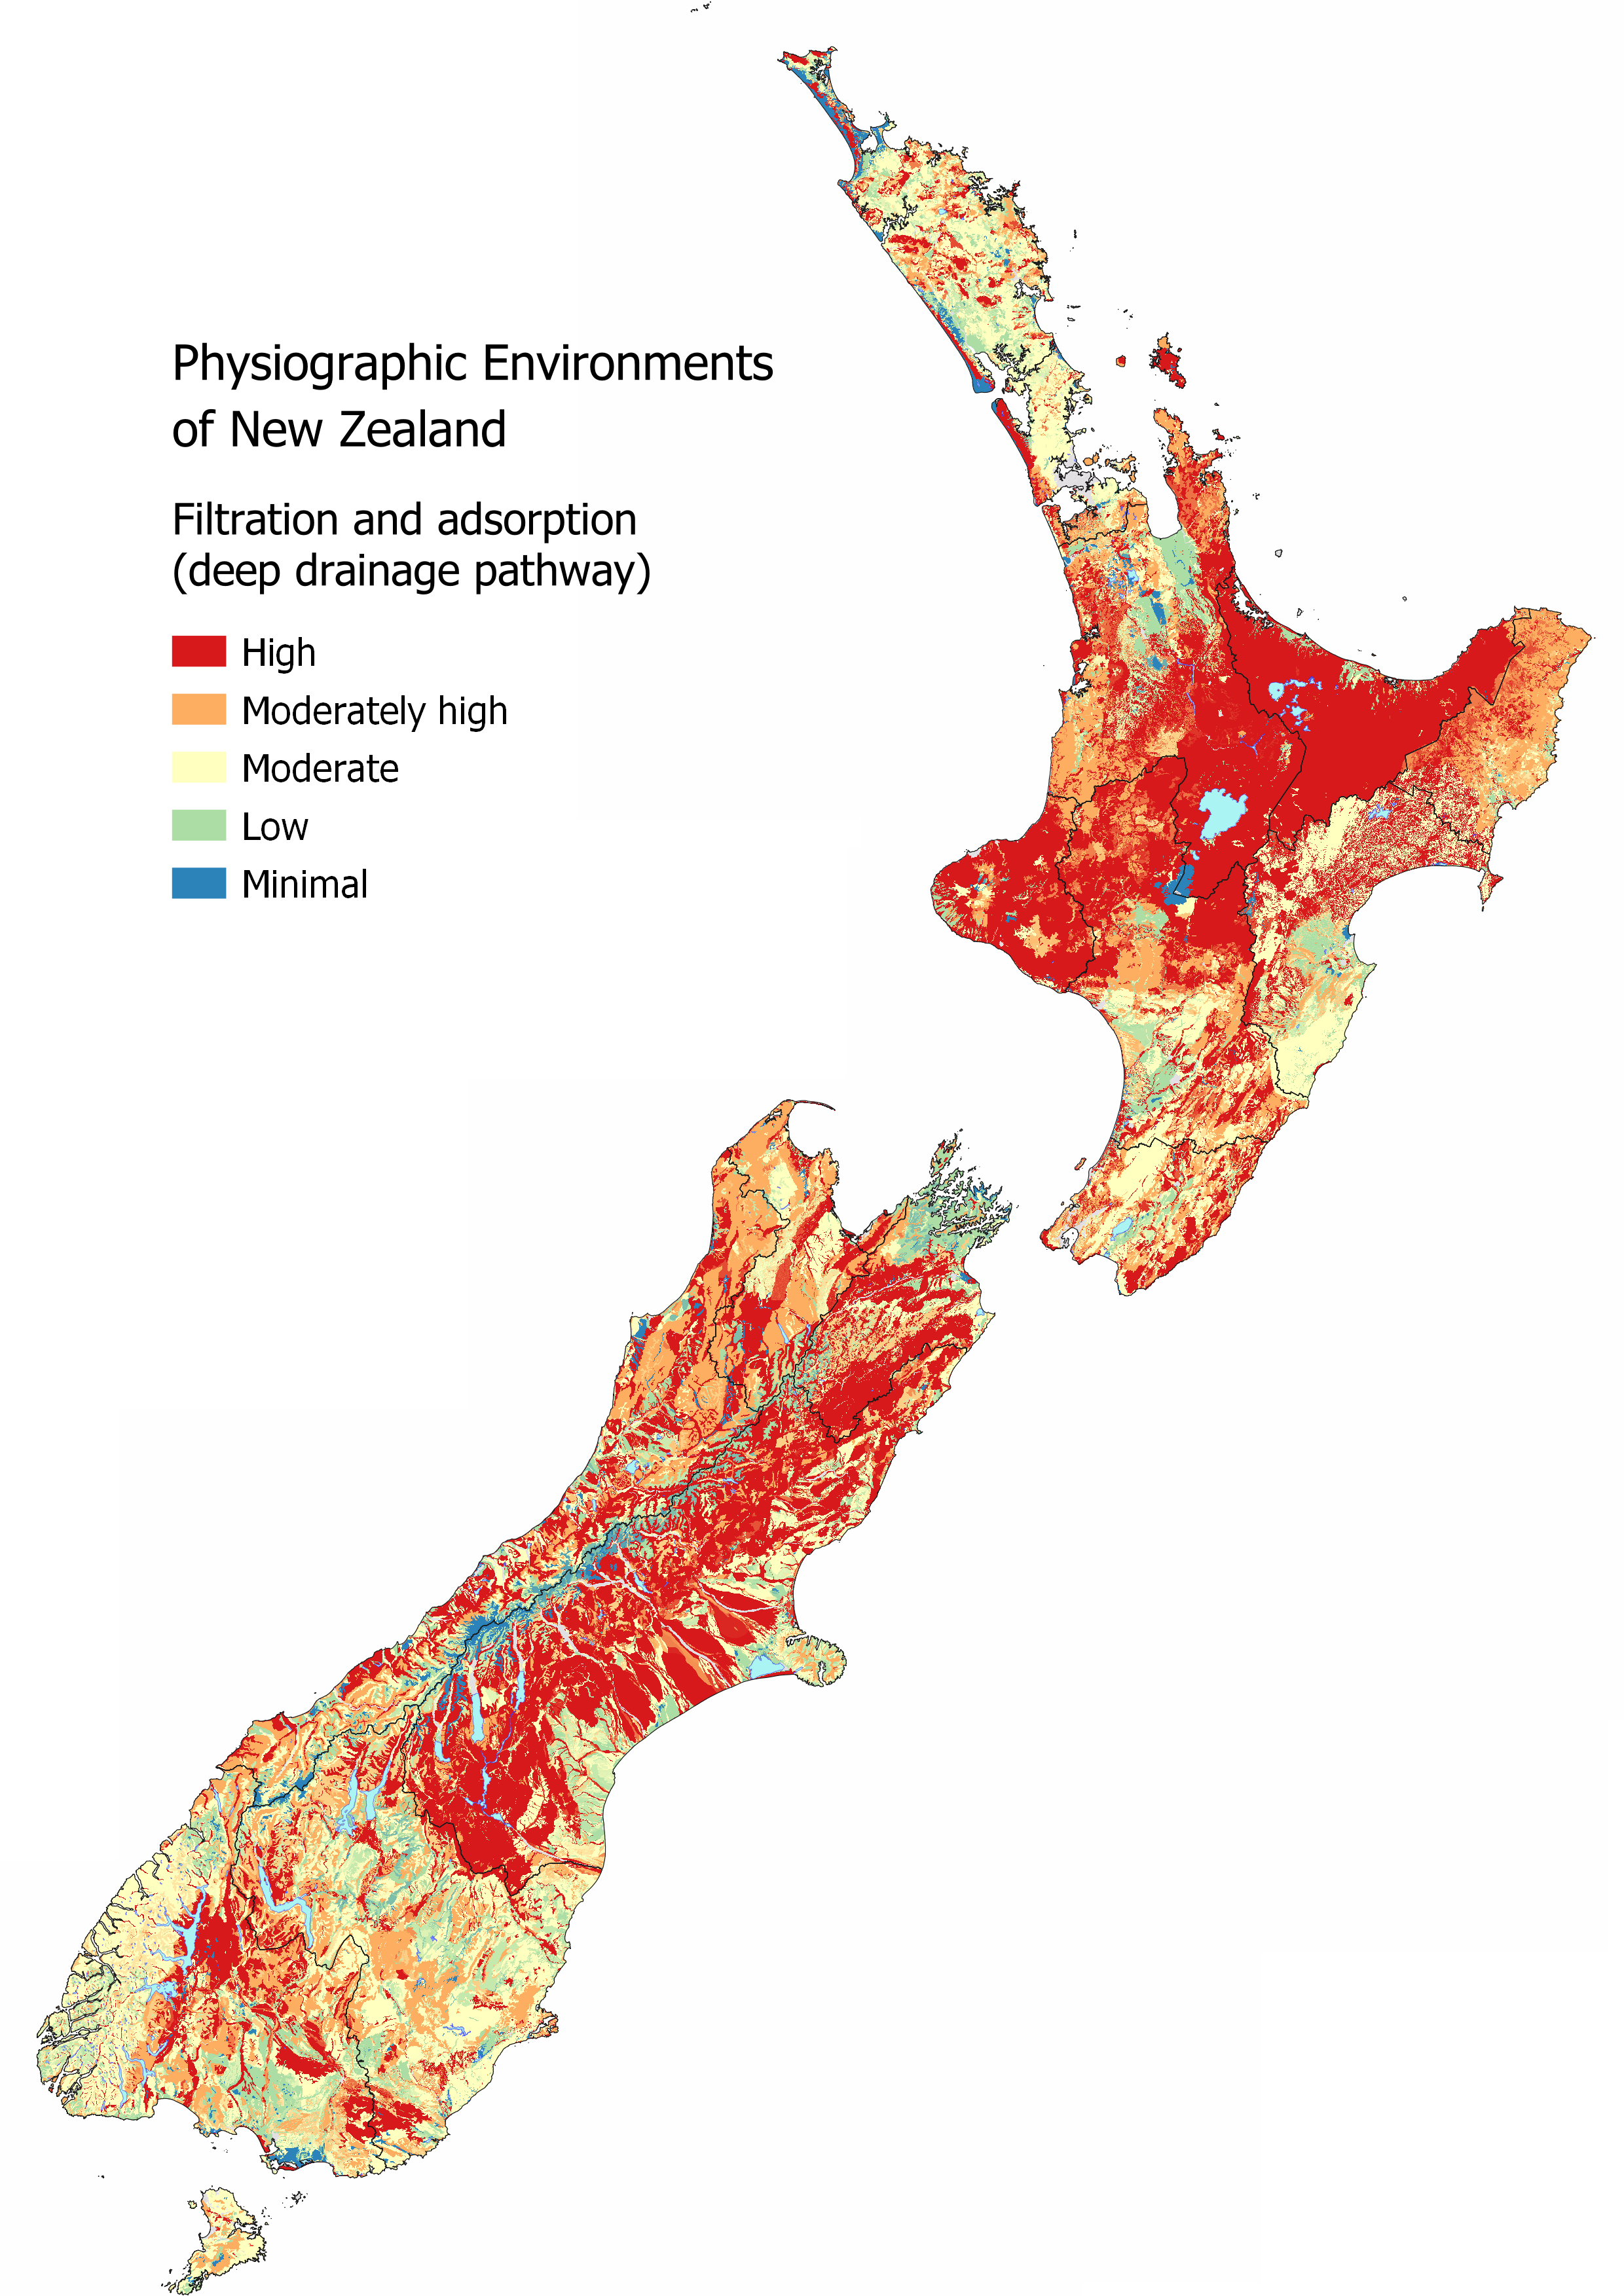
What is filtration and adsorption?
Filtration is a physical process where particles, such as sediment or microbes, are physically removed from water by becoming trapped in the pore spaces between soil and aquifer particles. Particulates can bind to the surface of soil and aquifer particles through adsorption, removing them from solution. Drainage pathways that involve infiltration of water through the soil or aquifer material result in the removal of most particulate contaminants (including microbial) between the source and the receiving environment.
Explore the MAPS – HYDROLOGY for more information, specifically the Deep Drainage map which informs where areas are likely to have the highest filtration and adsorption potential as water can percolate into the soil zone. However, if soil depth is shallow there is less retention of particles as Overland Flow risk increases. Water Table Depth is also important as recharge to the underlying aquifer can occur relatively quickly in areas with a shallow unsaturated zone compared to areas with a deep unsaturated zone. The presence of Artificial Drainage will also reduce the filtration and adsorption potential as the underlying aquifer is likely to be bypassed as water is routed directly to streams through the artificial drainage network.
How do redox reactions reduce contaminants?
Not all nitrate-nitrogen lost from the soil root zone will remain as nitrate as chemical processes that occur naturally in the landscape can convert the nitrogen back into dinitrogen gas (the main gas that makes up the air we breathe). This type of chemical reaction is known as a redox reaction (or oxidation-reduction reaction). The process of removing nitrate specifically is called denitrification and is part of the nitrogen cycle.
Redox processes are a type of chemical process that occurs in soil and shallow groundwater driven by microorganisms. Redox processes control the concentration of the dissolved forms of nitrate and nitrite, oxygen, manganese, iron, sulphate, and heavy metals. Soil zone redox processes, in conjunction with nitrogen load, also determine the magnitude of soil zone greenhouse gas emissions, such as nitrous oxide and methane.
The main ingredient for redox is organic matter as it is the main food source for microbes. Oxidising soils and geology typically have a lower abundance of organic matter (electron donor) and are oxic (oxygen rich). Nitrate lost through the soil in these areas is more likely to accumulate in the groundwater as there is a low potential for reduction from biological removal (denitrification). Reducing soils and geology (high organic matter content) tend to have lower oxygen (suboxic to anoxic) and may be highly reducing, meaning any electron acceptors e.g., oxygen or nitrate, are rapidly removed.
However redox reactions are not all win:win with regard to water quality contaminants, as redox also indirectly controls the leachability and mobility of phosphorus species in soils, aquifers, and subsequently surface waters. Oxidising soils will adsorb phosphorus to the soil particles (see filtration and adsorption). As soils and aquifers become more reducing, phosphorus becomes more mobile as the iron and manganese compounds the phosphorus is bound to breaks down increasing the concentration of dissolved phosphorus in the water.
As redox processes occur in both the soil zone and underlying aquifer, it is important to know the hydrology to establish if the reduction potential is realised. For example, a highly drained mineral soil will have a lower reduction potential than the same soil unmodified by drainage. The contact and time water spends in the soil under saturation are significantly lower limiting the time for microbes to denitrify but increasing the capacity for the soil to adsorb phosphorus.
For more information on redox processes see SCIENCE – CHEMICAL PROCESSES.
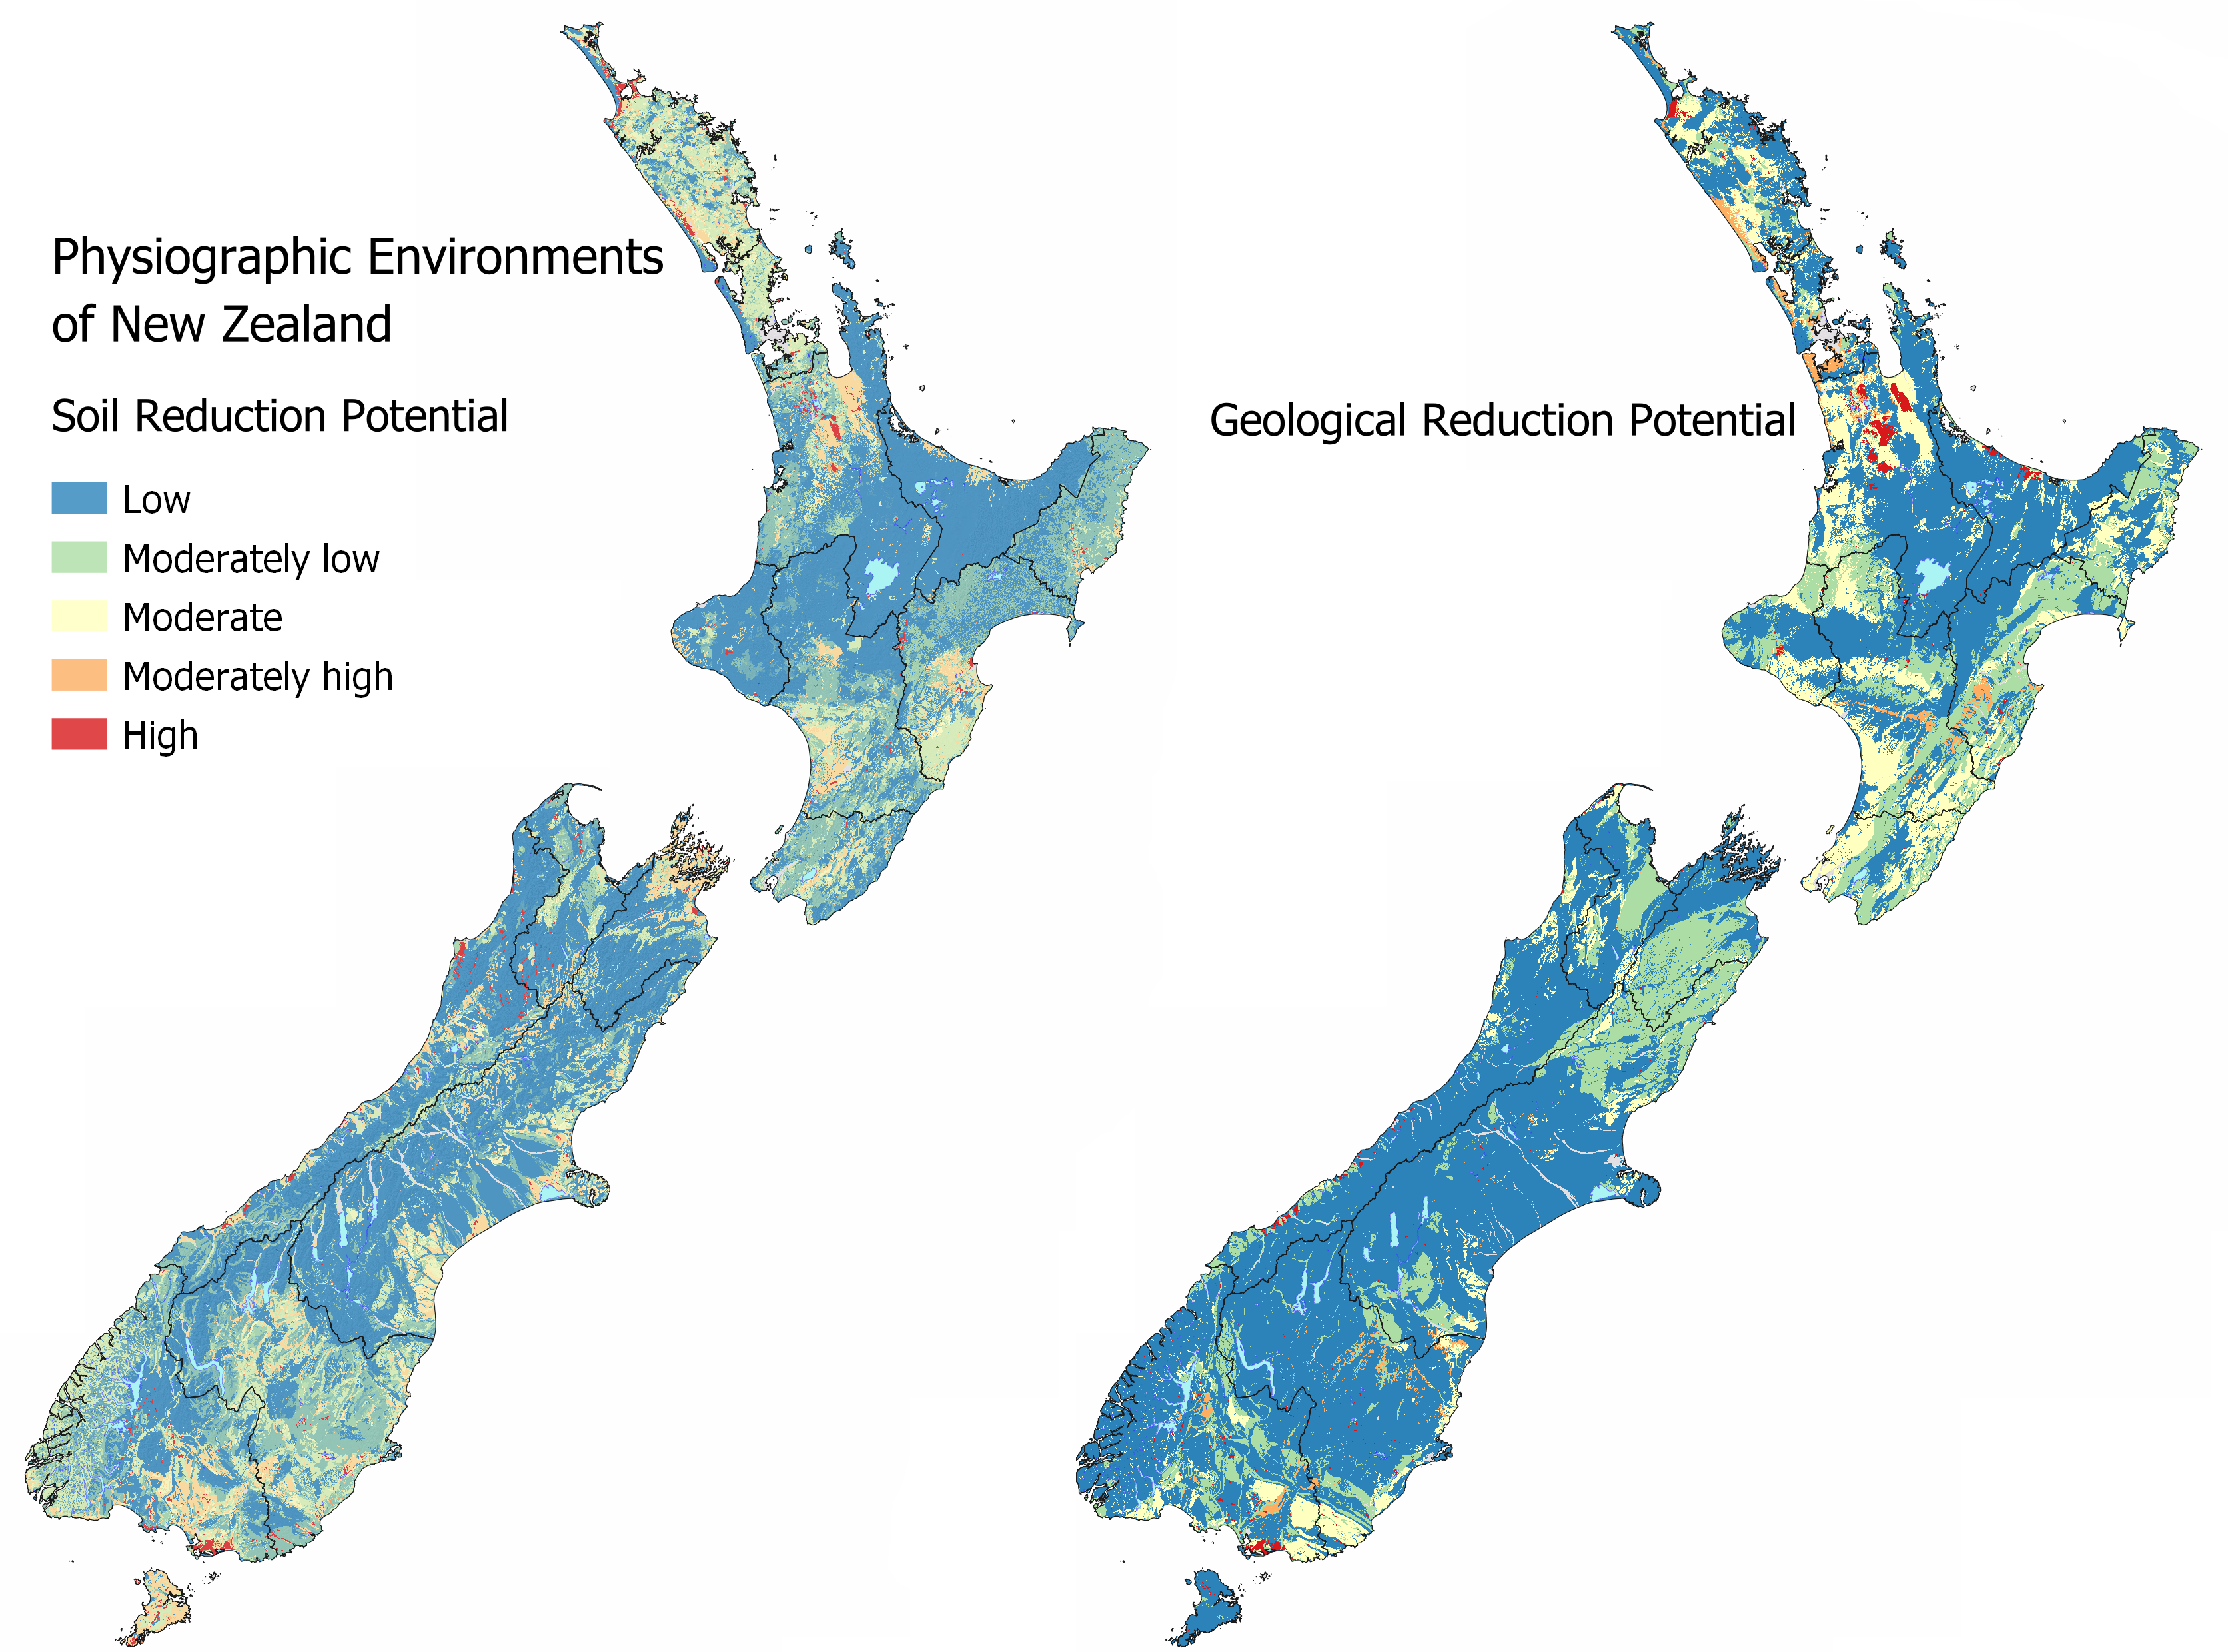
Maps of the Soil Reduction Potential and Geological Reduction Potential are available in MAPS – CHEMICAL PROCESSES.