Reducing Soil and Aquifer
Occurrence
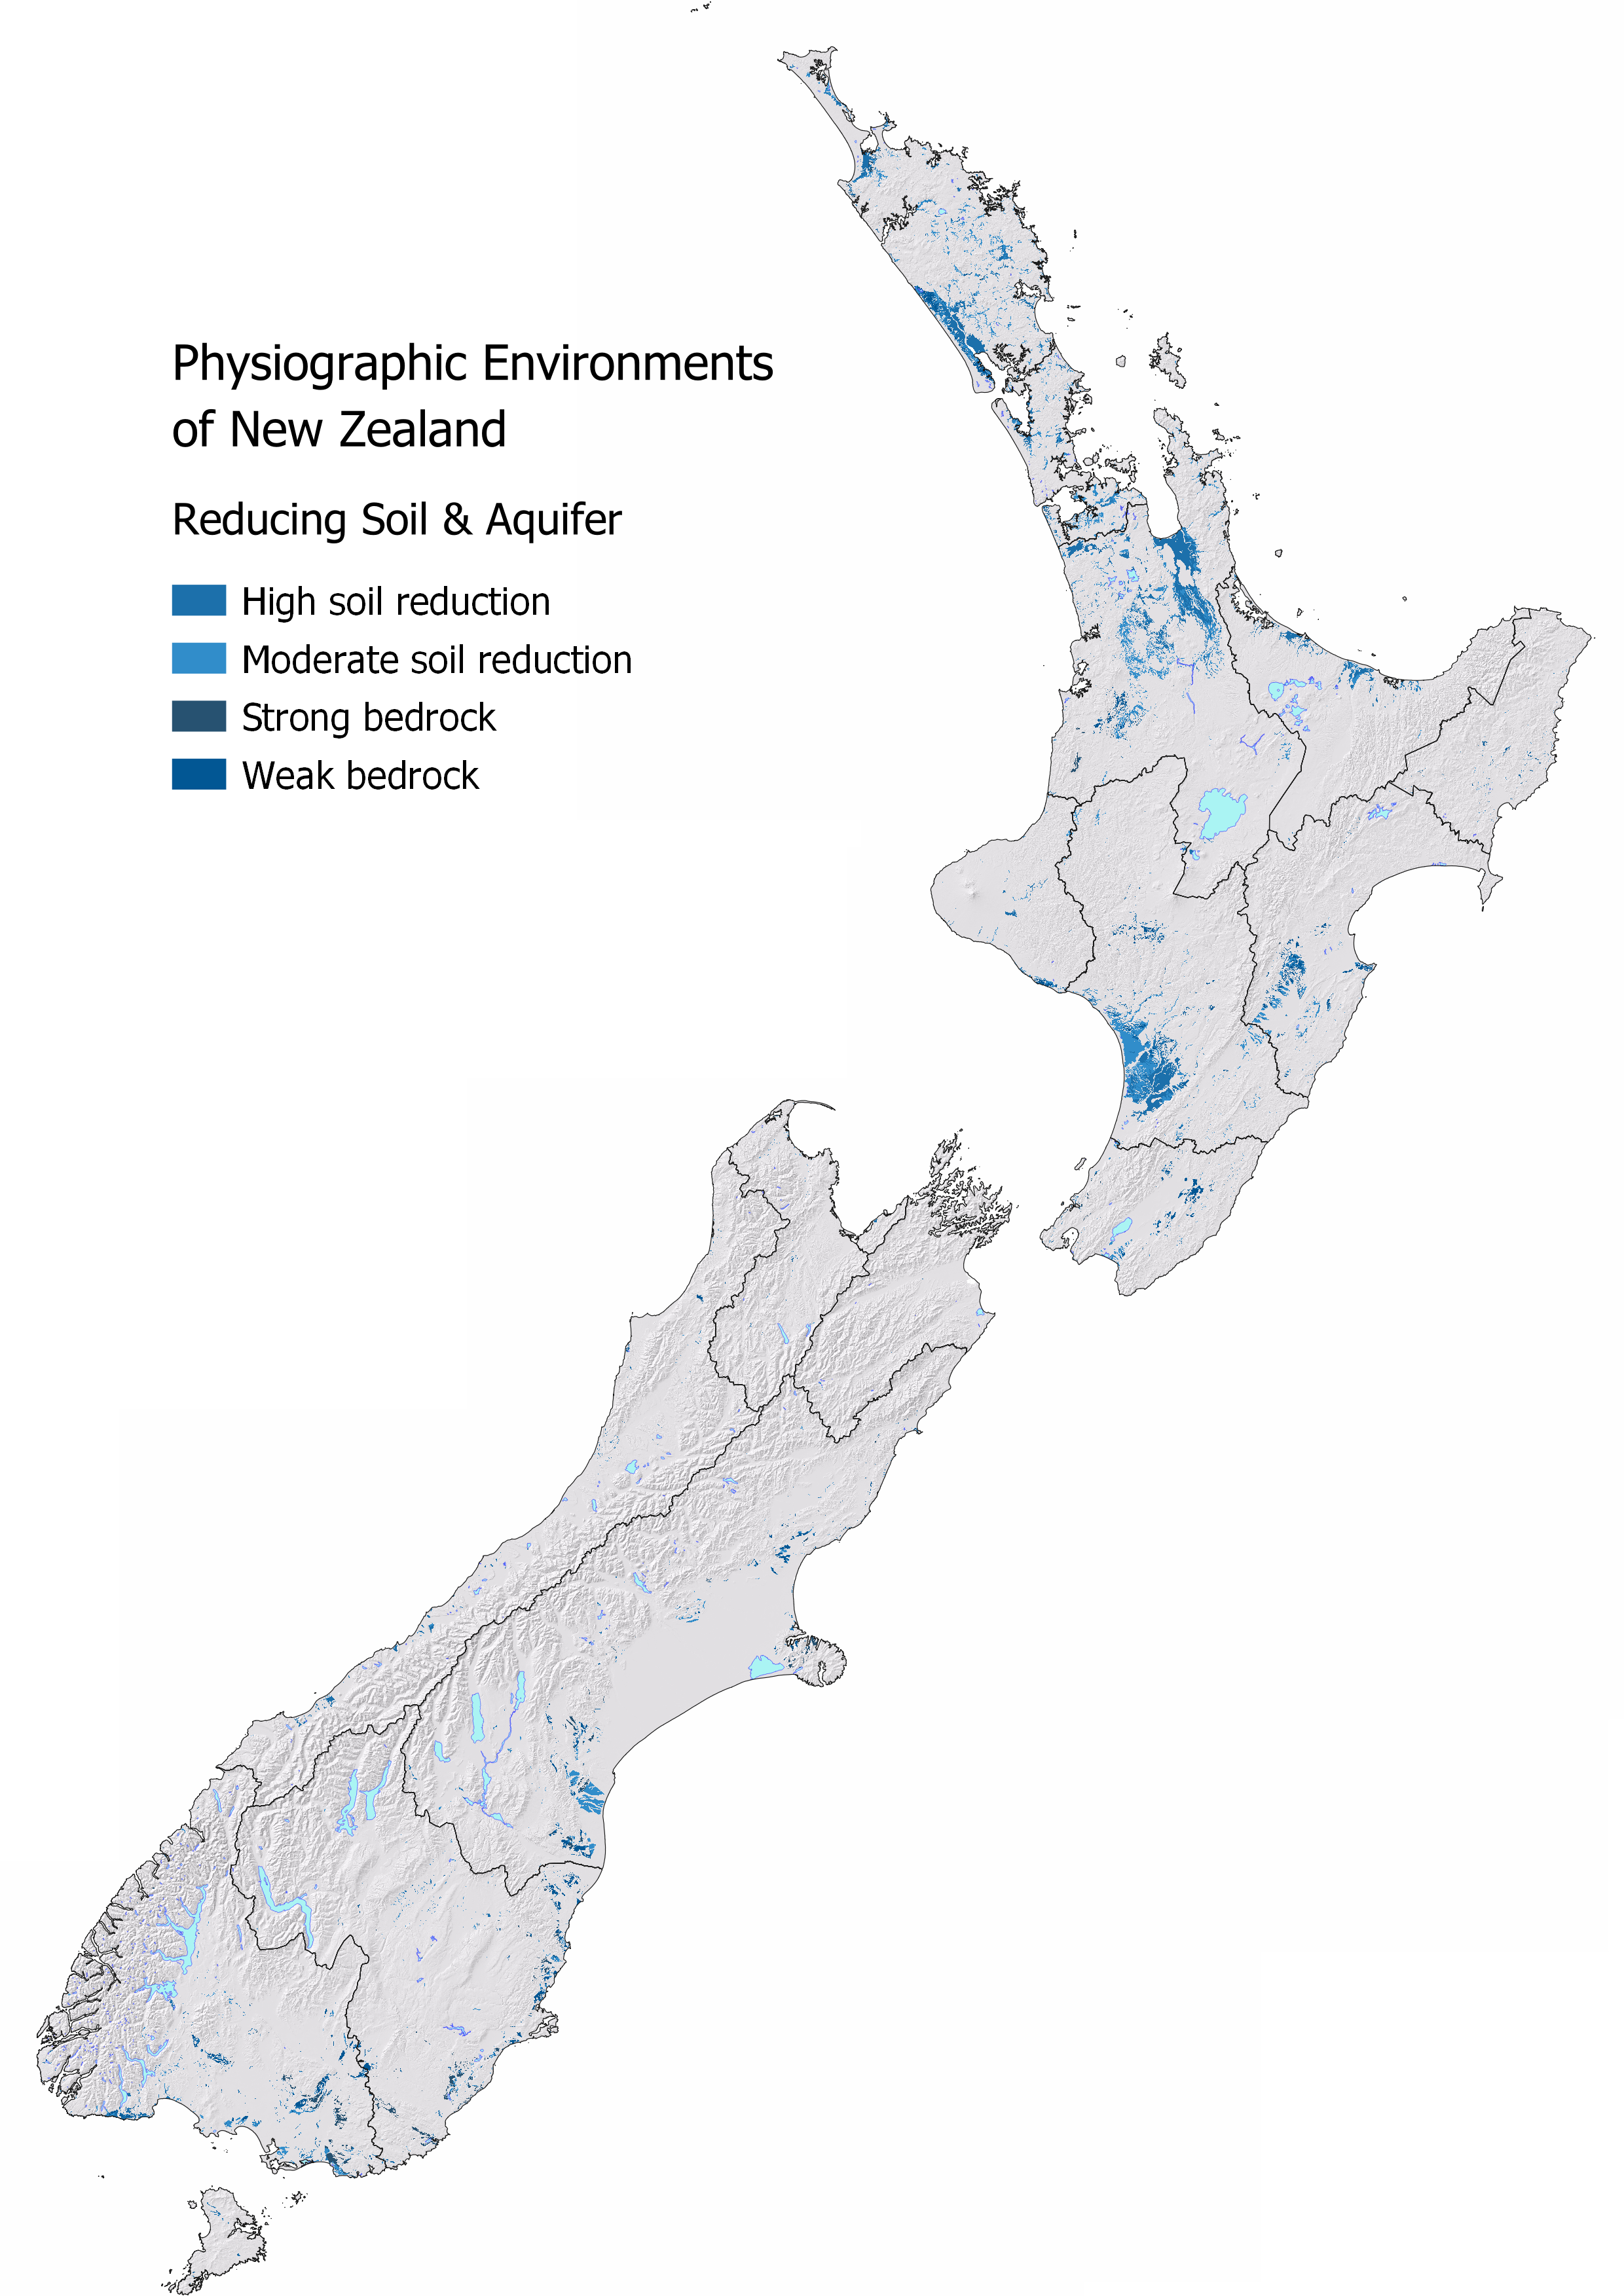
The Reducing Soil Reducing Aquifer Environment occurs predominantly in lowland areas where there are fine textured silt or clay rich, imperfect to poorly drained soils and oxygen limited underlying aquifers. Where the soil is reducing, grey colours and distinctive rust-coloured spots are visible. Aquifers can be moderate to highly reducing depending on the carbon content of the underlying geology. Typical reducing geologies include mudstones, marine or estuarine sediments, lignite and coal measure sediments, and peats. This environment may also be associated with the fringe of wetlands.
Nationally 3.21% or 844,921 ha of New Zealand is classified as Reducing Soil and Aquifer Environment. Waikato, Manawatu, and Northland have the largest areal extent. Northland has the highest proportion of the region classified as Reducing Soil and Aquifer Environment.
| Region | Area (ha) | Regional (%) | National (%) |
|---|---|---|---|
| Waikato | 196,505 | 8.25 | 0.75 |
| Manawatu | 157,337 | 7.09 | 0.60 |
| Northland | 127,768 | 10.25 | 0.49 |
| Southland | 80,455 | 2.59 | 0.31 |
| Canterbury | 71,361 | 1.61 | 0.27 |
| Otago | 54,137 | 1.74 | 0.21 |
| Auckland | 41,506 | 8.47 | 0.16 |
| Hawkes Bay | 40,072 | 2.84 | 0.15 |
| Gisborne | 37,859 | 4.52 | 0.14 |
| Bay of Plenty | 25,667 | 2.13 | 0.10 |
| Wellington | 21,906 | 2.73 | 0.08 |
| West Coast | 10,965 | 0.47 | 0.04 |
| Taranaki | 10,574 | 1.46 | 0.04 |
| Tasman | 1,856 | 0.19 | 0.01 |
| Nelson | 317 | 0.75 | 0.00 |
| Marlborough | 305 | 0.03 | 0.00 |
Water Source and Flow Pathway
In this environment there is a low potential for water dilution from Alpine or Bedrock Environments as local rainfall is the main source of water in this setting. Local rainfall infiltrates the soil and is modified by microbial activity under limited oxygen in the reducing soils and underlying aquifer. Aquifer contributions to stream tend to be reducing and of minor volume relative to the Oxidising Soil and Aquifer Environment.
The high water table results in drainage occurring as shallow lateral flow or as runoff over the land surface. In agricultural areas, artificial drainage is often used to lower the water table and improve soil drainage. This allows more oxygen into the soil and minimises the occurrence of runoff but creates a pathway for water to transport contaminants through.
Landscape Characteristics
The ability to filter and adsorb contaminants in the soil zone is largely dependent on the drainage pathway. Runoff has the highest risk of loss for ammoniacal nitrogen and microbial losses from animal wastes, and both sediment, and phosphorus. This risk is reduced in areas with artificial drainage as water can drain deeper through the soil. However, as the soil is more oxygenated the ability to remove nitrate naturally through denitrification is lower, with nitrate nitrogen lost to surface waterways through the artificial drainage network. Any denitrification occurring in the soil zone or underlying aquifer will produce both the harmless dinitrogen gas, which makes up the majority of our atmosphere, and nitrous oxide, a harmful greenhouse gas.
In the waterway, sediment can lower water clarity and smother the stream bed, particularly after rainfall events. High nutrient concentrations can result in excessive algae and plant growth and can be toxic to aquatic organisms. This also reduces the ability to use the waterway for gathering mahinga kai and recreation.
Sibling and Variations
The Reducing Soil and Aquifer Environment has four siblings:
High soil reduction occurs where soils are predominantly poorly drained.
Extent: 297,992 ha (1.13% of New Zealand)Moderate soil reduction occurs where soils are imperfectly drained. Soils with imperfect drainage are likely to take on similar characteristics to the oxidising soils during dry periods which increases the likely attenuation of phosphorus in the soil and any leached nitrogen is likely to be denitrified in the underlying aquifer.
Extent: 344,744 ha (1.31% of New Zealand)Over strong bedrock is a transitional class between the Reducing Soil and Aquifer Environment and the Strong Bedrock Environment. This sibling identifies where soils occur over strong bedrock which affects how deep water can drain and limits the aquifer potential of the environment. Strong bedrock is more likely to host fractured rock aquifers than weak bedrock.
Extent: 59,744 ha (0.23% of New Zealand)Over weak bedrock is a transitional class between the Reducing Soil Oxidising Aquifer Environment and Weak Bedrock Environment. It identifies where soils occur over weak bedrock which affects how deep water can drain and limits the aquifer potential of the environment.
Extent: 142,442 ha (0.54% of New Zealand)
Variants have a large role in changing the predicted hydrological response and contaminant risk profile in this environment and are highly seasonal. Check if they apply for your location MAPS – PHYSIOGRAPHIC ENVIRONMENTS.
Artificial drainage variant is common in areas of agricultural land and changes the predicted contaminant profile, especially over the wetter months. See Artificial Drainage Variant for more details.
Overland flow risk is elevated in areas of agricultural land and changes the predicted contaminant profile, especially over the wetter months when the water table is high and soils can become saturated easily. See Overland Flow Variant for more details.
Natural soil bypass is common in this environment where soils are derived from calcareous (calcium rich) or mafic (magnesium rich) parent materials. These soils are prone to cracking when dry (under soil moisture deficit) or are naturally jointed creating a natural bypass channel for water to drain bypassing the soil matrix. See Natural Soil Bypass Variant for more details.
| Reducing Soil & Aquifer Environment | Contaminant pathway (dominant hydrological pathway) | How the landscape regulates water quality contaminants | Risk to receiving environment | ||||
|---|---|---|---|---|---|---|---|
| Dilution | Resistance to erosion | Filtration and adsorption | Attenuation: N-Reduction | Attenuation: P-Reduction | |||
| High soil reduction | Lateral drainage through the soil zone either to stream or a neighbouring environment. Recharge to the underlying aquifer is limited by the soil permeability. Overland flow is common due to seasonal wetness (see Overland flow variant when pathway is active). Artificial drainage is common under agricultural land uses (see Artificial Drainage variant details if present). | Low | Moderately low - Low | Low | High | Low | Concentration & load to surface water, minor groundwater contribution |
| Moderate soil reduction | Lateral drainage through the soil zone either to stream or a neighbouring environment. Lateral drainage is likely to become more vertical (deep) during the drier months. Recharge to the underlying aquifer is limited by the soil permeability (likely higher than high soil reduction sibling as soils are imperfectly drained). Overland flow occurs due to seasonal wetness (see Overland flow variant when pathway is active). Artificial drainage is likely under agricultural land uses (see Artificial Drainage variant details if present). | Low | Moderate | Low - Moderate | Moderately high - High | Low – Moderately low | Concentration & load to groundwater and surface water |
| Over strong bedrock | Lateral drainage along contact with bedrock. Slope and depth to bedrock controls overland flow risk where the steeper the slope or shallower the bedrock the more likely it is to occur (see Overland flow variant when pathway is active). Limited aquifer potential. Artificial drainage may be present under agricultural land uses (see Artificial Drainage variant details if present). | Low | Low - Moderate | Low - Moderate | Moderate - High | Low - Moderate | Concentration & load to surface water, minor groundwater contribution |
| Over weak bedrock | Lateral drainage along contact with bedrock. Slope and depth to bedrock controls overland flow risk where the steeper the slope or shallower the bedrock the more likely it is to occur (see Overland flow variant when pathway is active). Limited aquifer potential. Artificial drainage may be present under agricultural land uses (see Artificial Drainage variant details if present). | Low | Low - Moderate | Low - Moderate | Moderate - High | Low - Moderate | Concentration & load to surface water, minor groundwater contribution |
| Hydrological Variants | Occurrence (See MAP VARIANTS to check if they apply at your location) | ||||||
| Artificial drainage | Likely where agricultural soils have impeded drainage or a shallow water table. Pathway is most active during the wetter months. | N/A¹ | Moderate – Moderately high | Moderate – Moderately high | Low - Moderate | Moderate – Moderately high | Concentration & load to surface water |
| Overland flow | Occurs when soils are saturated and/or infiltration is limited. Pathway is active after prolonged or intense rainfall. | N/A¹ | Low | Low | Low | Low | Concentration & load to surface water |
| Natural soil zone bypass | Occurs when soils are cracked (under soil moisture deficit) or jointed. Pathway is active following extended periods of soil moisture deficit | N/A¹ | Low | Low | Low | Low | Concentration & load to groundwater |
¹ Dilution potential is assessed by the Physiographic Environment recharge domain which is indicative of water source and relative volume. This does not change with the hydrological variant.
Contaminant Profile
| Reducing Soil & Aquifer Environment Sibling | Nitrogen | Phosphorus | Sediment | Microbes | |||
|---|---|---|---|---|---|---|---|
| Nitrate & Nitrite | Ammoniacal | Organic (Dissolved & Particulate) | Particulate | Dissolved Reactive | Particulate | Particulate | |
| High soil reduction | Low | High | High | High | Moderately high | High | High |
| Moderate soil reduction | Low - Moderately low | Moderate – Moderately high | Moderate – Moderately high | Moderate – Moderately high | Moderate | Moderate – Moderately high | Moderate – Moderately high |
| Over strong bedrock | Low - Moderately low | Moderate - High | Moderate - High | Moderate - High | Moderate – Moderately high | Moderate - High | Moderate - High |
| Over weak bedrock | Low - Moderately low | Moderate - High | Moderate - High | Moderate - High | Moderate – Moderately high | Moderate - High | Moderate - High |
| Hydrological variants | |||||||
| Artificial drainage | Moderately low - Moderately high | Moderately low - Moderate | Moderately low - Moderate | Moderate | Moderately low | Moderate | Moderate |
| Overland flow | Low | High | High | High | Low | High | High |
| Natural soil zone bypass | High | High | Moderate | Low | Moderate | Low | High |
Key Actions
In this environment, mitigation activities should focus on preventing bypass pathways. In areas that are prone to runoff, vegetated buffer areas, sediment traps, and riparian planting are all ways of intercepting runoff and minimising contaminant loss. Maintaining good soil structure is critical to prevent runoff from occurring. In areas with artificial drainage, minimise surplus nitrogen in the soil prior to the wetter season to reduce losses through the artificial drainage network.